
A primer on equalization in Canada
Saskatchewan Premier Brad Wall’s call for changes to Canada’s system of equalization makes an overview of Canada’s equalization system timely.
Equalization is a per capita transfer to provincial governments with below average fiscal capacity as calculated via a formula that compares a province’s ability to generate revenues to the average revenue of all 10 provinces. Provincial government revenue sources used to calculate equalization include personal income taxes, business income taxes, consumption taxes, property taxes and natural resources.
In 2014-15, total equalization to the six provinces (Manitoba, Quebec, Ontario, New Brunswick, Nova Scotia and Prince Edward Island) was $16.7 billion. In 2014-15, the provinces that did not receive equalization were Newfoundland & Labrador, Saskatchewan, Alberta and British Columbia.
Equalization has been a part of Canada’s federal system of intergovernmental transfers since 1957 and according to the Federal Department of Finance “is the Government of Canada's transfer program for addressing fiscal disparities among provinces. Equalization payments are intended to enable less prosperous provincial governments to provide their residents with public services that are reasonably comparable to those in other provinces, at reasonably comparable levels of taxation.”
The roots of equalization are found in Canadian fiscal and economic history. The Dominion Subsidies were the first federal transfer payment in recognition of diminished provincial fiscal capacity as a result of the provinces giving up customs duties as a revenue source to the federal government at the time of Confederation. The Dominion Subsidies were a general per capita grant that amounted to a payment of 80 cents per person. The rationale for a system of transfers to equalize fiscal capacity harkens back to the 1940 Royal Commission on Dominion-Provincial Relations popularly known as the Rowell-Sirois Report, which recommended a system of National Adjustment Grants.
Figure 1 (below) plots total equalization from 1957 to 2015. The sources for constructing this series include data and documents available on the Finance Canada website as well as an old manuscript document titled “The Fiscal Equalization Program, Federal Provincial Relations Division, Department of Finance, October 1991” that provided the entitlements from 1957 to 1991. In 1957, equalization paid out $139.1 million and has grown to reach an estimated $17.3 billion in 2015. When converted into 2002 dollars to adjust for inflation using the Consumer Price Index, the increase is from approximately $1 billion in 1957 to an estimated $13.6 billion by 2015.

All of the provinces have at one point or another collected equalization—even Alberta from 1957 to 1963—though its share of the total paid out is miniscule. What is also interesting is that while Ontario has only been collecting equalization since 2009, it has already collected more than either Saskatchewan or P.E.I. ever did.
Figure 2 (below) presents a comparison by province from three years: 1957, 1990 and 2014. Quebec and Ontario’s share of equalization have grown over time. Newfoundland’s has declined to zero. Nova Scotia’s has declined slightly, P.E.I. stayed stable and New Brunswick’s share increased. Meanwhile, the three westernmost provinces have all seen their shares decline to zero while Manitoba’s has stayed the same.

Figure 3 (below) presents a regional perspective by combining the four Atlantic provinces, joining Ontario and Quebec into Central Canada and putting the four western provinces together. When equalization began in 1957, the three regions were remarkably balanced in terms of equalization shares but there was a rapid divergence with the share of Central Canada (essentially Quebec) increasing while that of the West declined. Atlantic Canada’s share remained stable. A major shift in the balance occurs after 2005 with a rapid rise in Central Canada’s share (fuelled especially by Ontario’s debut as a recipient in 2009) and a drop in the share of both the West and Atlantic Canada. The changes since 2005 are partly tied to the increase in oil prices, which in turn affects the natural resource revenue component of the formula.
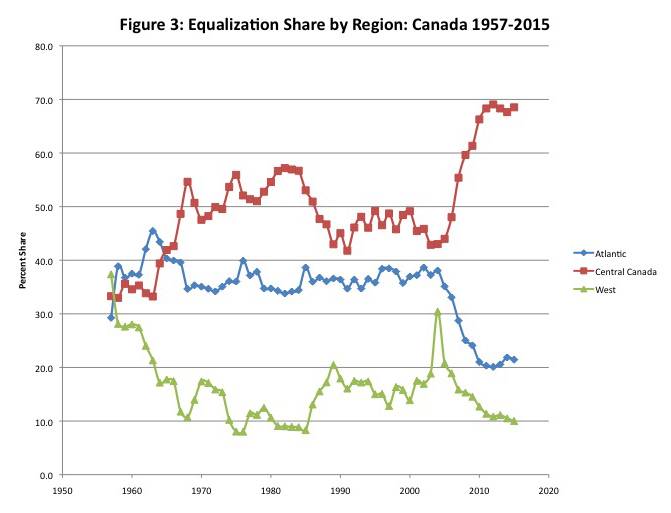
What Figure 3 also illustrates is the erosion of Central Canada’s fiscal capacity as a result of its recent economic decline. Ontario and Quebec together now account for nearly 70 per cent of equalization entitlements whereas the West only accounts for 10 per cent. What is also interesting is that the Atlantic share has also declined—fuelled by the improvement in Newfoundland & Labrador’s fiscal performance as a result of the resource boom.
Given the West’s declining share of equalization in recent years, Brad Wall’s call for change should not be seen as that surprising.
Author:
Subscribe to the Fraser Institute
Get the latest news from the Fraser Institute on the latest research studies, news and events.