
Canada’s rising federal employment—making sense of the numbers
The public sector and the functioning of government bureaucracies, especially when it comes to employment, should be of great interest to taxpayers at all levels of our federation. In the case of Canada’s federal government, its core departments and separate agencies have seen employment grow from 211,925 in 2000 to 258,979 in 2016. This represents an increase in employment of 47,054 jobs or 22.2 per cent.
This total includes active employees of all employment tenures (indeterminate, term, casual and student), governor-in-council appointees, deputy ministers and federal judges. However, it also excludes inactive employees (e.g. employees on leave without pay), ministers’ exempt staff, employees locally engaged outside of Canada, RCMP regular force members, RCMP temporary civilian Force members and Canadian Forces members. It also excludes the Canadian Security Intelligence Service, the National Capital Commission, Canada Investment and Savings, Canadian Forces Non-Public Funds and Security Intelligence Review Committee (before 2010).
The numbers for this analysis come from the Government of Canada website, as of March 31 of each year, and there are a total of 128 core departments and separate agencies listed. The first chart below illustrates the trend in this total employment showing growth from 211,925 in 2000 to a peak of 282,980 in 2011 for an increase of nearly 34 per cent. However, a steady decline then sets in after 2011 bringing employment down to 257,034 by 2015 and then an increase in 2016 to 258,979. Between 2011 and 2016, the decline is just over 8 per cent. However, what’s also quite interesting is where the increases have occurred as well as where there have been declines.

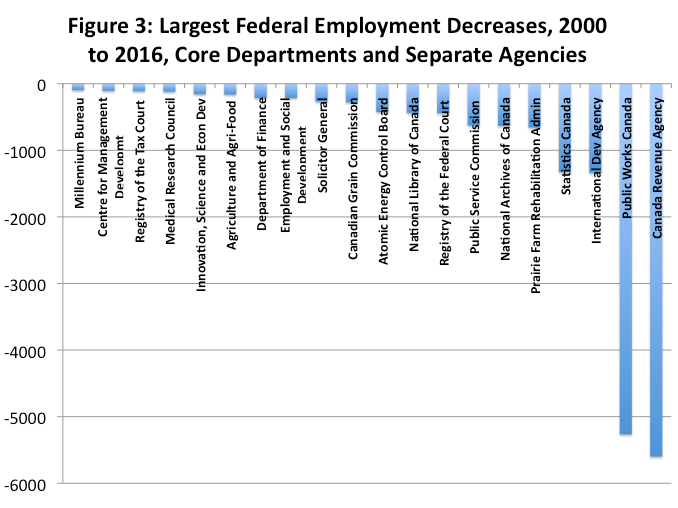
Charts two and three below present the numbers for top 20 increases and decreases in employment across government departments and separate agencies since 2000. In terms of absolute numbers, the biggest increases have been the Canada Border Services Agency (14,171), the Public Services and Procurement Department (5,848), National Defence (5,538) and Shared Services Canada (5,157). The biggest decreases have been the Canada Revenue Agency (5,599), Public Works Canada (5,265), the International Development Agency (1,337) and Statistics Canada (1,326).

Of course, while some of these changes reflect changing national priorities and successful advocacy by bureaucrats, some of these increases also reflect shifting and reallocation of functions across departments.
For example, there was no Canada Border Services Agency in 2000 though there were still border services so the better comparison might be between 2005 (when the agency first appears) and 2016 making for an increase from 9,510 to 14,171—a less dramatic but still substantial increase.
Passport Canada is a similar outfit coming into existence in 2003 with 1,345 employees who obviously were issuing passports before this date.
Then there are some agencies that come into existence and disappear during this period such as the Canada Firearms Centre, which appears in 2005 with 310 employees and then disappears in 2008 with employment of zero. Even Passport Canada hits 2,696 employees in 2013 and then goes to zero the year after.
For an economist with an interest in public finance and fiscal numbers pertaining to government revenue and spending, the most interesting numbers are those for three items: Statistics Canada (-1,326), Department of Finance (-213) and the Canada Revenue Agency (-5,599). In percentage terms, since 2000, these federal bodies have seen their employment decline 19, 22 and 12 per cent respectively while total federal employment has grown 22 per cent. There has been little evidence as to whether these types of changes have been driven by any analysis of what the optimal staffing of federal departments should be.
I suppose its not that they do not like working with numbers in Ottawa. The employment decline of these quantitative oriented departments has been accompanied by the rise of intriguingly named quantitative entities such as Statistical Survey Operations, which first appears in 2005 with 2,084 employees, peaks at 2,371 employees in 2012, and then declines to 1,701 employees by 2016. The Office of the Auditor General grows from 542 employees in 2000 to 588 employees in 2016 while the Office of the Superintendant of Financial Institutions goes from 364 to 667 employees.
With all these ebbs and flows, it really is all quite fascinating. However, aside from what drives federal employment growth, a key policy question is what determines the allocations across functions and departments?
Author:
Subscribe to the Fraser Institute
Get the latest news from the Fraser Institute on the latest research studies, news and events.