
Government spending—the problem in Newfoundland and Labrador
The public finances of Newfoundland and Labrador are in a bit of a pickle after a period that saw considerable improvement as the province benefitted from the offshore oil and gas boom.
In the wake of the collapse of the cod fisheries in the 1990s, the poor economic situation resulted in large deficits and a piling on of provincial debt to the point where the province’s net debt-to-GDP ratio peaked in the late 1990s at nearly 70 per cent. It then declined and dipped below 25 per cent in fiscal year 2011-12 before beginning another ascent in the wake of the fall in oil prices.
Indeed, the piling on of deficits in the last few years has raised the net debt-to-GDP ratio to just below 50 per cent.
The public finances of Newfoundland and Labrador have been challenging. Over the period 1980 to 2016, there has only been a budget surplus seven out of 37 fiscal years, making deficit financing a chronic condition. Moreover, six of these seven surpluses were during the period of more robust economic growth after 2000.
Indeed, as the oil and gas boom took hold, N.L. became a non-equalization receiving province and the federal transfer share of total provincial government revenues fell from 44 per cent in 2000-01 to a low 13 per cent by 2012-13 before climbing back to 17 per cent in 2016-17.
The deterioration of the province’s public finances has been especially acute since 2012-13, with deficits that have grown into the billion-dollar range. The province’s net debt has spiraled upwards since 2012 from about $8 billion to more than $14 billion. Of course, the immediate reaction to this turn of events is to simply blame the fiscal situation on the downturn in world commodity prices that has hurt not only N.L.’s economy but also Alberta and Saskatchewan.
However, a glance at the chart below suggests there’s more to the story than just an economic downturn.
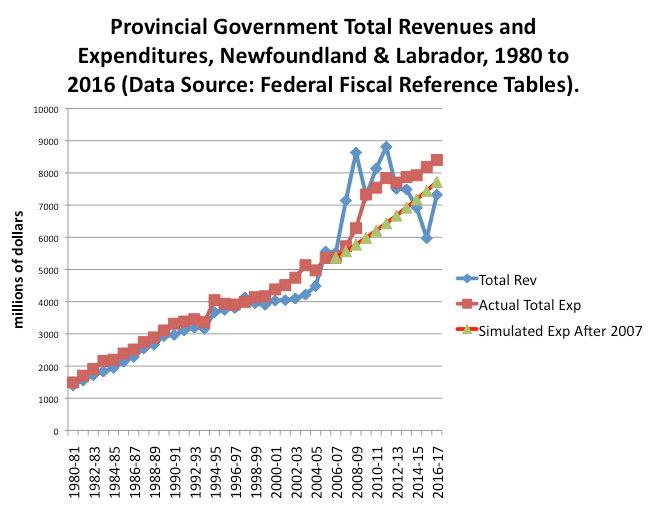
The chart plots total provincial government revenues and expenditures since 1980-81; it shows an abrupt upward shift in both revenues and spending with revenues starting to spike in about 2007-08 and expenditures in 2008-09. The response of the N.L. government to its revenue growth was to enrich spending to match the surge in resource revenues. Perhaps a more prudent strategy would have been to continue growing expenditures at historical rates and putting away the additional revenues into a sovereign wealth fund to deal with the proverbial rainy day.
Over the period 2000 to 2006, the average annual growth rate of total revenues was 5.4 per cent while total expenditure grew at only 3.7 per cent. During the period 2007 to 2016, revenues grew at 4.1 per cent whereas expenditures grew at 4.7 per cent. If after 2006, expenditures had continued to grow at an average annual rate of 3.7 per cent—a significant amount given inflation of about 2 per cent and essentially flat population growth—the result would have been massive accumulated surpluses from 2006-07 to 2013-14 totalling $11.6 billion.
The simulation expenditure line in the chart shows the expenditure trajectory with a 3.7 per cent growth rate. The period since 2013-14 would still have seen deficits, but rather than $4.3 billion, there would have only been $2.1 billion in accumulated deficits. And that could have been more than countered by a rainy day fund of $11.6 billion, with resources to spare.
In the end, there’s been a massive expenditure problem when it comes to the recent budgetary woes of Newfoundland and Labrador. The resource boom was used to fuel an increase in spending that was not prudent given the boom/bust pattern of a resource economy. Such are the wages of spending excess.
Author:
Subscribe to the Fraser Institute
Get the latest news from the Fraser Institute on the latest research studies, news and events.