
24 facts for 2024—Canadians should understand impact of government policies
— January 15, 2024

With a better understanding of the impact of government policies, Canadians will be better able to hold politicians accountable and make informed decisions at the ballot box. With the calendar now turned to 2024, here are 24 facts for Canadians to consider.
Canada’s Economic Crisis
- Average per-person incomes in Canada have stagnated from 2016 ($54,154) to 2022 ($55,863). Meanwhile, the United States has seen an increase from $65,792 to $73,565. The average Canadian now earns $17,700 less annually than the average American.
- Canada ranks just below Louisiana ($57,954) in average per-person income and slightly ahead Kentucky ($54,671). This is not exactly the bar Canadians should be aiming for.
- According to the Organisation for Economic Co-operation and Development, Canada will be the worst-performing advanced economy from 2020 to 2030 and from 2030 to 2060.
- Canada’s economic growth crisis is due in large part to the decline in business investment. Business investment per worker in Canada declined by 20 per cent since 2014, from $18,363 to $14,687.
- In 2014, Canada invested about 79 cents per worker for every dollar invested in the United States—in 2021, investment was 55 cents for every U.S. dollar.
- We’ve witnessed a massive flight of capital from Canada since 2014, to the tune of more than $285 billion.
- From the onset of the COVID recession in February 2020 to June 2023, the number of government jobs across the country increased by 11.8 per cent compared to only 3.3 per cent in the private sector (including the self-employed).
Fiscal Crisis: Imprudent Spending and Massive Deficits
- The Trudeau government has increased annual spending (not including interest payments on its debt) by nearly 75 per cent since 2014, from $256 billion in 2014-15 to a projected $453 billion in 2023-24.
- With federal spending at nearly $11,500 per Canadian, the Trudeau government is on track to record the five highest levels of per-person spending in Canadian history.
- A large portion of government spending in Canada goes to pay for the 4.1 million federal, provincial and local government employees. Government employees across Canada—including federal, provincial and municipal workers—are paid 31.3 per cent higher wages (on average) than workers in the private sector. Even after adjusting for differences (education, tenure, type of work, occupation, etc.) government employees are still paid 8.5 per cent higher wages.
- The Trudeau government has used large increases in borrowing and tax increases to finance this spending. Federal debt has ballooned to $1.9 trillion (2022-23) will reach a projected $2.4 trillion by 2027/28.
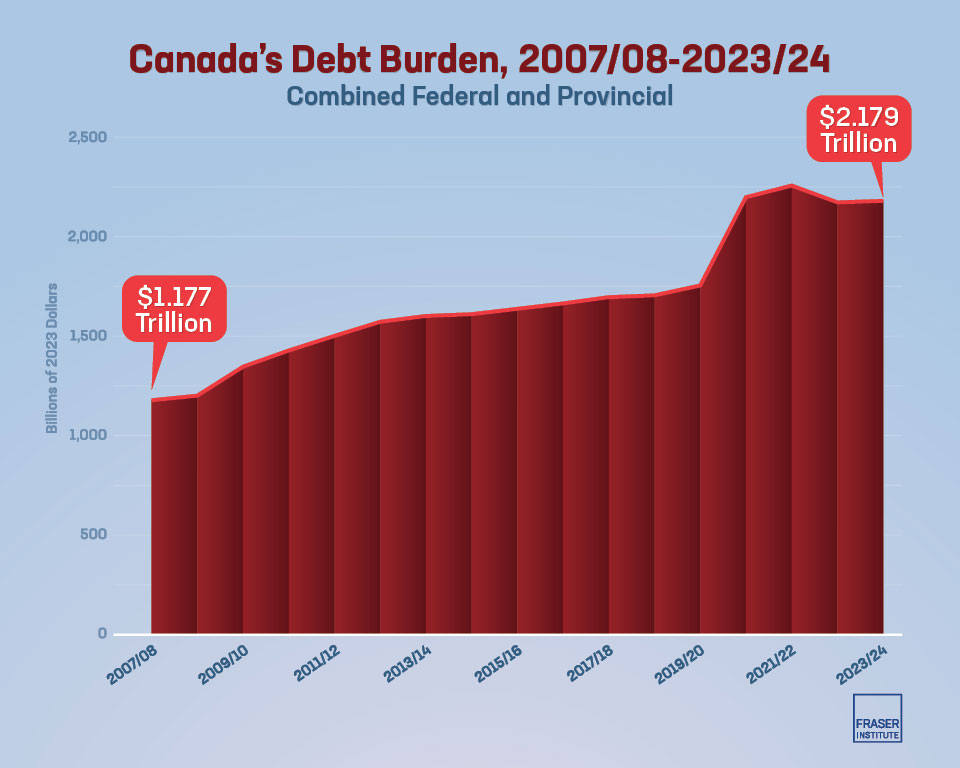
- Combined federal and provincial debt in Canada has nearly doubled from $1.18 trillion in 2007/08 (the year before the last recession) to a projected $2.18 trillion this year.
Tax Increases and Canada’s Affordability Crisis
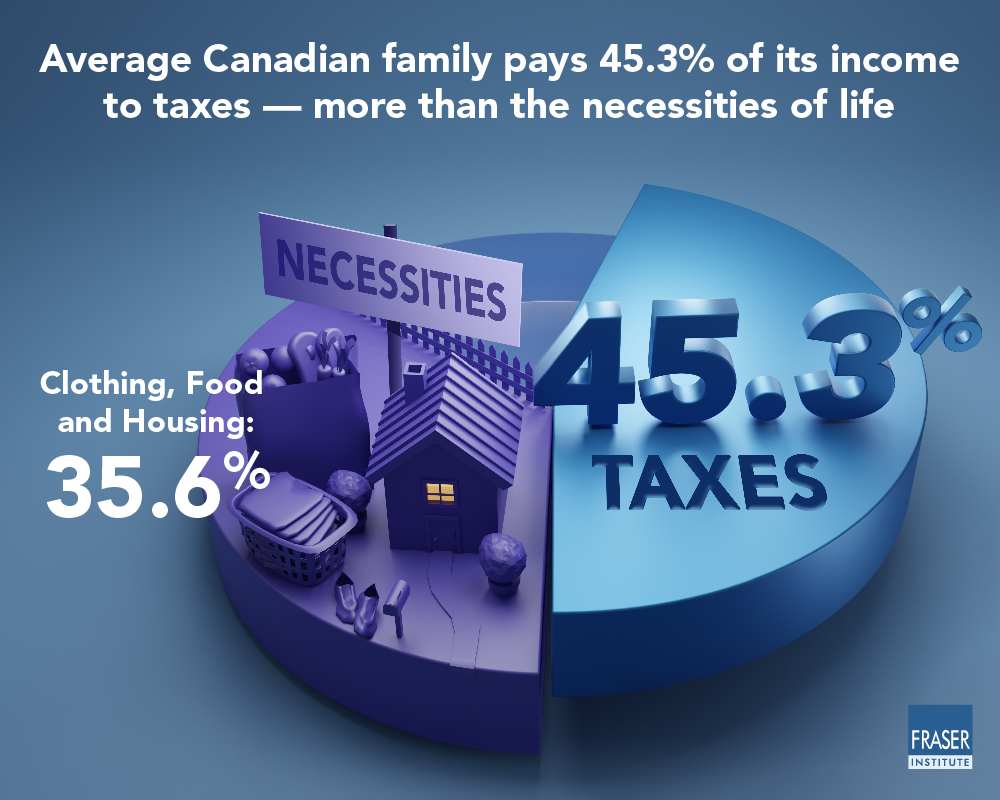
- To pay for all this spending, the total tax bill for the average Canadian family was $48,199 or 45.3 per cent of its income—more than what the average family spends on housing, food and clothing combined.
- Housing and grocery costs dominated the news last year but in 2022 the average family spent $1,452 more on housing and $996 more on food while governments extracted an extra $4,566 from the average family in taxes.
- While the federal government has claimed it “cut taxes for middle-class Canadians everywhere,” in reality 86 per cent of middle-class families in Canada are paying higher income taxes under the government’s personal income tax changes. And that doesn’t account for carbon taxes, etc.
- More than 60 per cent of lower-income families (those in the bottom 20 per cent of earners) in Canada now pay higher federal income taxes because of the federal government’s tax changes.
- Seventy-four per cent of Canadians surveyed believe the average family is being overtaxed by the federal, provincial and local governments.
Damaging Energy and Environment Policy
- In the federal government, there’s a common belief that the Canadian economy is undergoing a fundamental and rapid transition towards “clean/green” industries. Yet despite massive regulations and subsidies, Statistics Canada data shows that Canada’s “green” economy amounts to only about 3 per cent of gross domestic product (GDP) and directly employs roughly 1.6 per cent of all jobs.
- The recent United Nations climate change conference pushed for a "transition away from fossil fuels." Despite significant spending on “clean energy”, from 1995 to 2022, the amount of fossil fuels (oil, gas and coal) consumed worldwide actually increased by nearly 59 per cent.
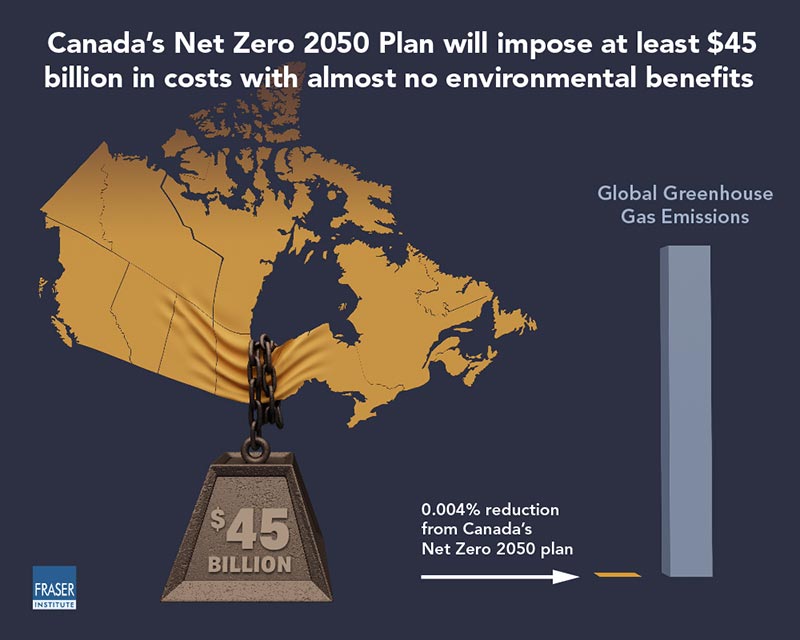
- Canada has an opportunity to serve the world with its energy and resources and, in doing so, benefit our allies and improve both world energy security and the environment. But the federal government doesn’t see it that way. How else could one explain the latest singling out of Canada’s oil and gas sector through an arbitrary cap on greenhouse gas emissions, even though the sector only represents 26 per cent of Canada’s total GHG emissions? Even if Canada eliminated all greenhouse gas emissions expected from the oil and gas sector in 2030, the reduction would equal only 0.004 per cent of global emissions while imposing huge costs.
- As a result of new federal energy efficiency regulations, the cost of a newly constructed home in Canada will increase by $55,000, on average, by 2030 because of the federal government’s stricter energy efficiency regulations for buildings. Rather than increasing the costs of new homes, governments should help close the gap between supply and demand.
Our Failing Health-Care System
- How good is our health-care system? Canada’s average health-care wait times hit 27.7 weeks in 2023—the longest ever recorded and nearly 200 per cent longer than the 9.3 weeks in 1993 when the Fraser Institute began tracking wait times.
- Among a group of 30 high-income countries that have universally accessible health care, Canada spends the most money on health care as a percentage of GDP.
- Despite this high spending, we are a poor performer. Among this group, Canada had the longest wait lists and ranked:
- 28th (out of 30) for the number of doctors
- 23rd (out of 29) for the number of hospital beds available
- 23rd (out of 29) for the number of psychiatric beds available
- 25th (out of 29) for the number of MRI machines
- 26th (out of 30) for CT scanners
Author:
Blog Category:
Subscribe to the Fraser Institute
Get the latest news from the Fraser Institute on the latest research studies, news and events.