Independent school enrolment reaches a high of 12.8 per cent in B.C. and a low of 0.8 per cent in New Brunswick.
student performance
Décembre 30, 2019
12:48PM

B.C. spends 19.6 per cent less than New Brunswick per student—$14,768 versus $11,879.
Décembre 17, 2019
3:06PM

Spending on public schools in Ontario increased from $25.5 billion to $27.9 billion.
Décembre 5, 2019
11:57AM

Three years later B.C. has fallen to fourth place in reading, science and math.
Décembre 5, 2019
11:44AM

Canada’s lowest average score was in math—12th overall.
Décembre 2, 2019
3:23PM

Canada’s national math score dropped 16 points from 2003 to 2015.
Novembre 1, 2019
11:52AM
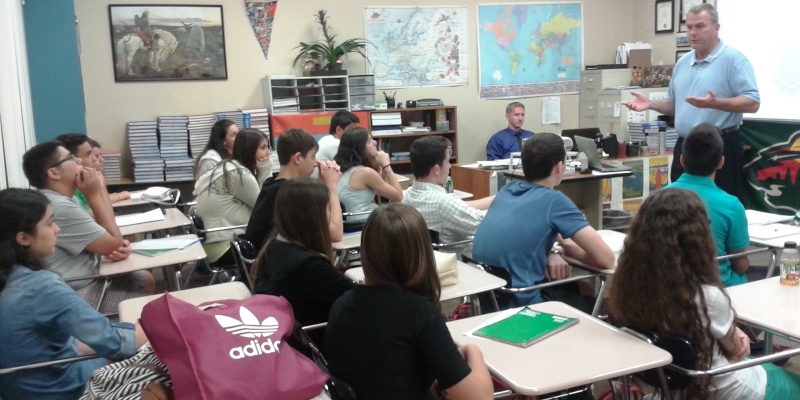
Singapore, the top-scoring country in math and science , had eight more students (on average) in its high school classes than Canada.
Octobre 17, 2019
9:35AM
After a certain point, you get less “bang for the buck” for any additional spending.
Octobre 16, 2019
9:48AM

PISA tests results are widely considered the global “gold standard” for measurement in this area.
Octobre 10, 2019
11:34AM
Ontario’s larger classes will remain smaller than classes in Quebec and Alberta.